In the previous update (15-July-2016) I discussed about the factor variable changes and few other things. You can read the complete article HERE.
Today I refined the first page consolidated report graphs. TOFFEE-Mocha (unlike TOFFEE) is a WAN Emulator, so the graphs are supposed to highlight this purpose and should display the overall network activity. Unlike TOFFEE, the TOFFEE-Mocha report should contain in general what is received versus what is sent across the wire. In case if the packet drop feature is enabled, you should see few missing bytes and packets. Similarly in future I may support packet duplication feature, in that case you may see more packets/bytes sent versus the packets/bytes actually received.
NOTE: The packet count is represented dynamically with the notation such as ‘K’ for Thousands, ‘M’ for Millions and so on.
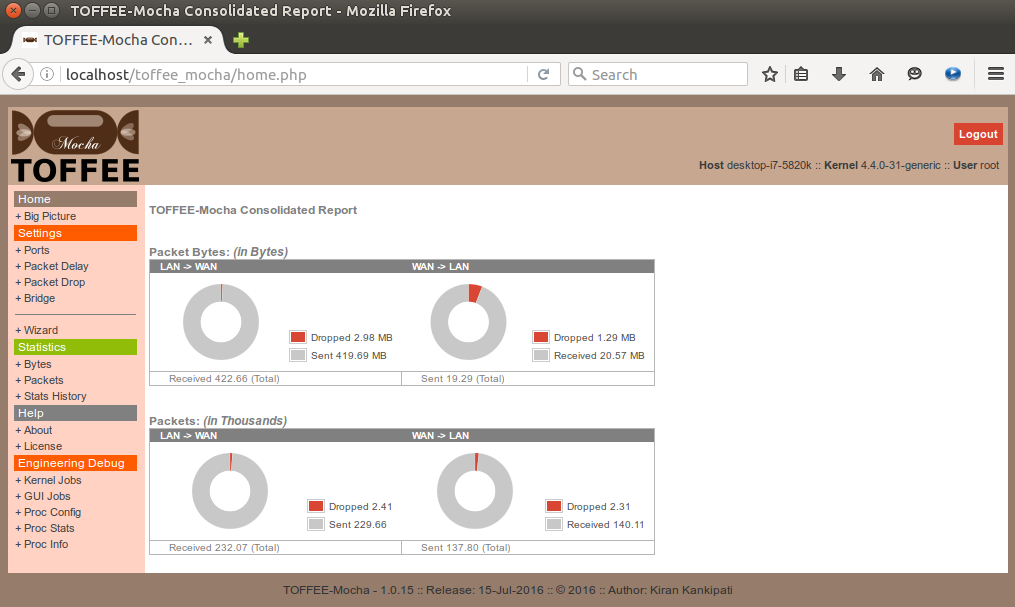
Hare is the latest TOFFEE-Mocha Home page:
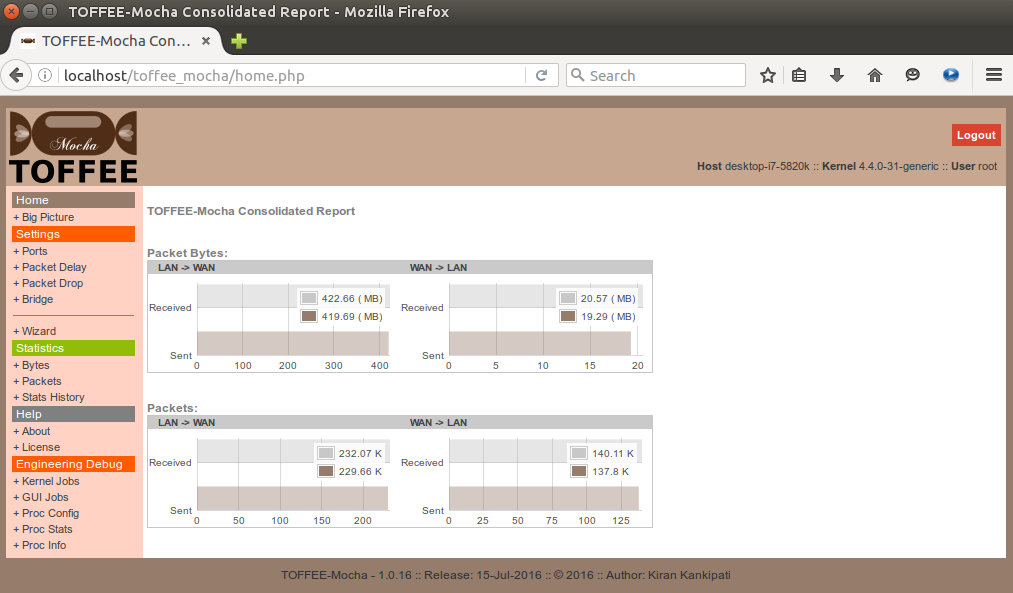
Hare is the old TOFFEE-Mocha Home page existed earlier: